
Why Your 40% Crypto Gains Are Underperforming
Why Relative Performance Makes or Breaks Your Crypto Returns

Long time no see my friend.
Hope you are enjoying the bull market just like I do.
One of my new years resolutions is to write at least 26 newsletters in 2025. This is number one, and we're starting with something crucial.
Let's be honest: despite the massive growth in crypto, quality information remains a huge challenge. Most content out there is either scattered across platforms, superficially researched, or buried under layers of noise. That's precisely why I created the Digital Investing Flywheel - to help you build compound knowledge about digital assets and develop investment strategies that actually work. No fluff, just practical insights that compound over time.
Today, we're diving into relative performance - arguably one of the most critical concepts for any crypto investor to master. With thousands of tokens competing for your attention, understanding this principle has never been more important.
Spoiler: many investors are leaving serious money on the table by ignoring this concept.
If you prefer a talking head on this topic, you can also check out my Youtube video.
Let’s get into it.
Absolute vs relative performance
Many crypto investors only focus on absolute returns without considering relative performance.
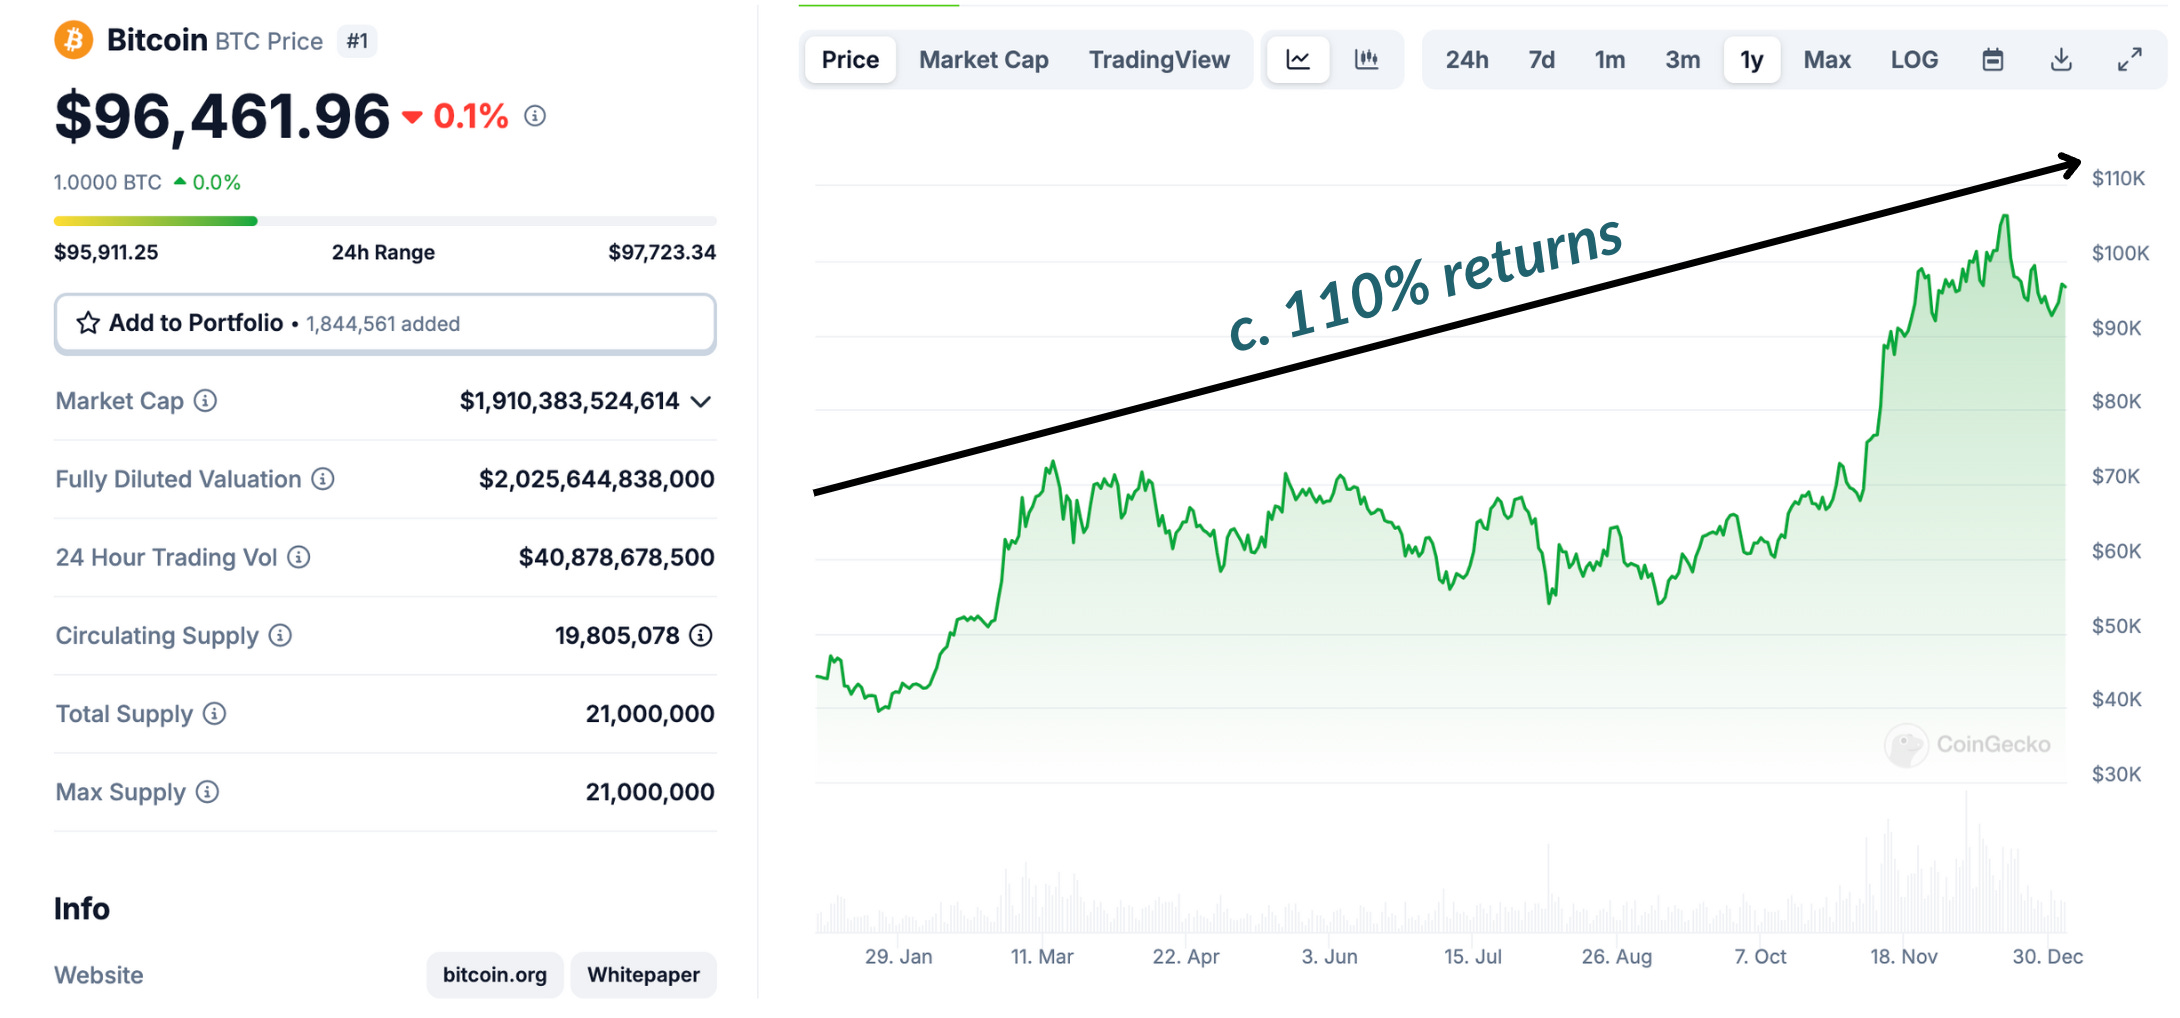
Making 40% with altcoins sounds impressive, until you realize Bitcoin gained around 110% in the same period. While you've secured a 40% absolute return, you've actually underperformed the market leader by 70%. That's not just leaving money on the table - it's taking on higher risk for lower rewards.
This blind spot in performance evaluation is perhaps one of the most expensive mistakes in crypto investing. It's like applauding yourself for running a 10-minute mile while the benchmark (BTC) is setting world records.
What gets measured gets managed - Peter Drucker
This timeless principle also holds true for tracking the performance of your investment portfolio, whether this is in stocks or cryptocurrencies.
The cryptocurrency market is like a roller coaster - its high volatility means you need solid reference points or benchmarks to determine whether your investments are performing well over time.
Think of benchmarks as your investment compass. They show whether you're truly outperforming the market or just riding a general upward trend. It's not just about how much money you've made or lost - it's about how well your investments perform compared to relevant sectors and specific assets.
We all know that the crypto market had a good year in 2024, but we also know that some tokens performed better than other tokens (e.g., SUI massively outperformed other Layer 1 cryptocurrencies).
Let's face it - if you're investing in altcoins, you're likely aiming to discover projects that will outperform Bitcoin and Ethereum in the long run. After all, that's the primary allure of venturing beyond these two crypto assets.
Here's the brutal truth: if your altcoin investments can't beat Bitcoin or Ethereum's performance over time, you're taking unnecessary risk. The two market leaders offer a more established track record, stronger network effects, and lower volatility. In essence, you'd be better off simply holding BTC or ETH instead of experimenting with higher-risk, lower-reward alternatives.
Think of it this way - altcoins need to justify their additional risk with proportionally higher returns. If they can't clear this hurdle, you're essentially paying a premium for inferior performance. Stay focused on this risk-reward reality when building your crypto portfolio.
You want to maximize every dollar or euro invested - after all, the goal is to get the best possible returns within your risk comfort zone. No one wants to leave money on the table.
Crypto performance dashboard
Let me introduce you to my custom-built crypto performance dashboard. This application solves the benchmarking problem by letting you:
Track Performance of cryptocurrencies in different crypto sectors such as Layer 1s, DeFi Tokens and meme coins
Benchmark against market leaders Bitcoin and Ethereum
Track sector-specific median performance to spot over/underperformers
Analyze multiple timeframes - from 7-day trends to annual performance
Layer 1 sector
Let's look at a real example: Here's a performance breakdown of major Layer 1 cryptocurrencies from January 2, 2024, to January 2, 2025.
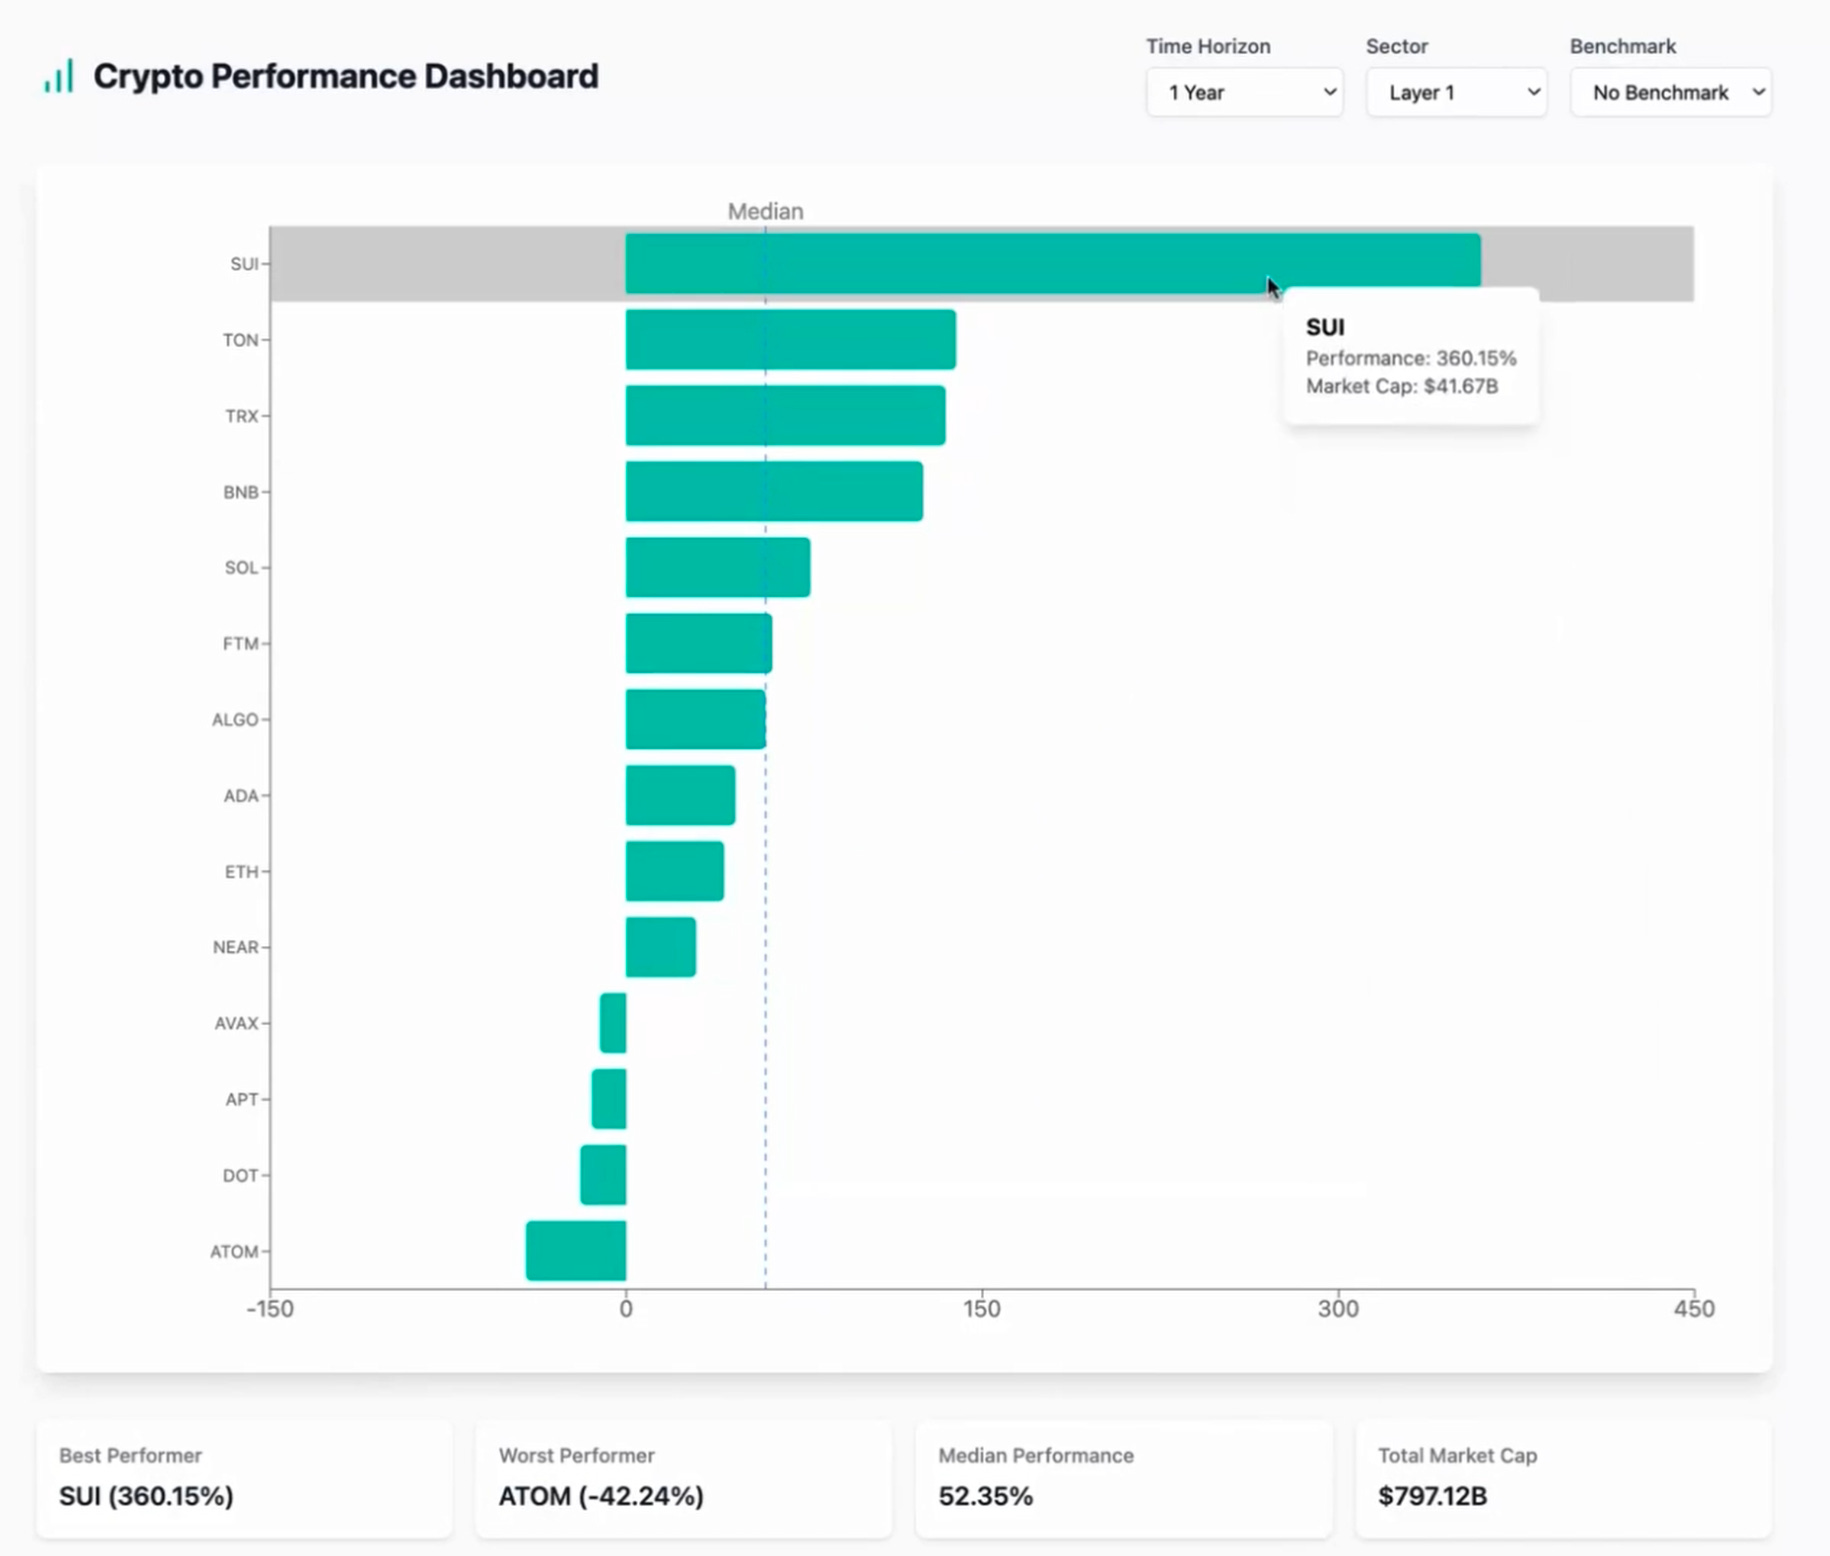
The percentages show you exactly how much these assets have grown (or shrunk) in the last year. Looking at the numbers, the Layer 1 sector has seen a median return of around 52%.
SUI, Ton, and Tron (TRX) are leading the pack last year. Whereas, Cosmos (ATOM), Polkadot (DOT), Aptos (APT), and Avalanche (AVAX) underperformed relatively to their peers.
Here's a mind-blowing stat: there's a massive 400% gap between the best and worst performers in this sector (SUI vs ATOM). That's the kind of spread that shows why picking winners in crypto can make such a huge difference to your returns.
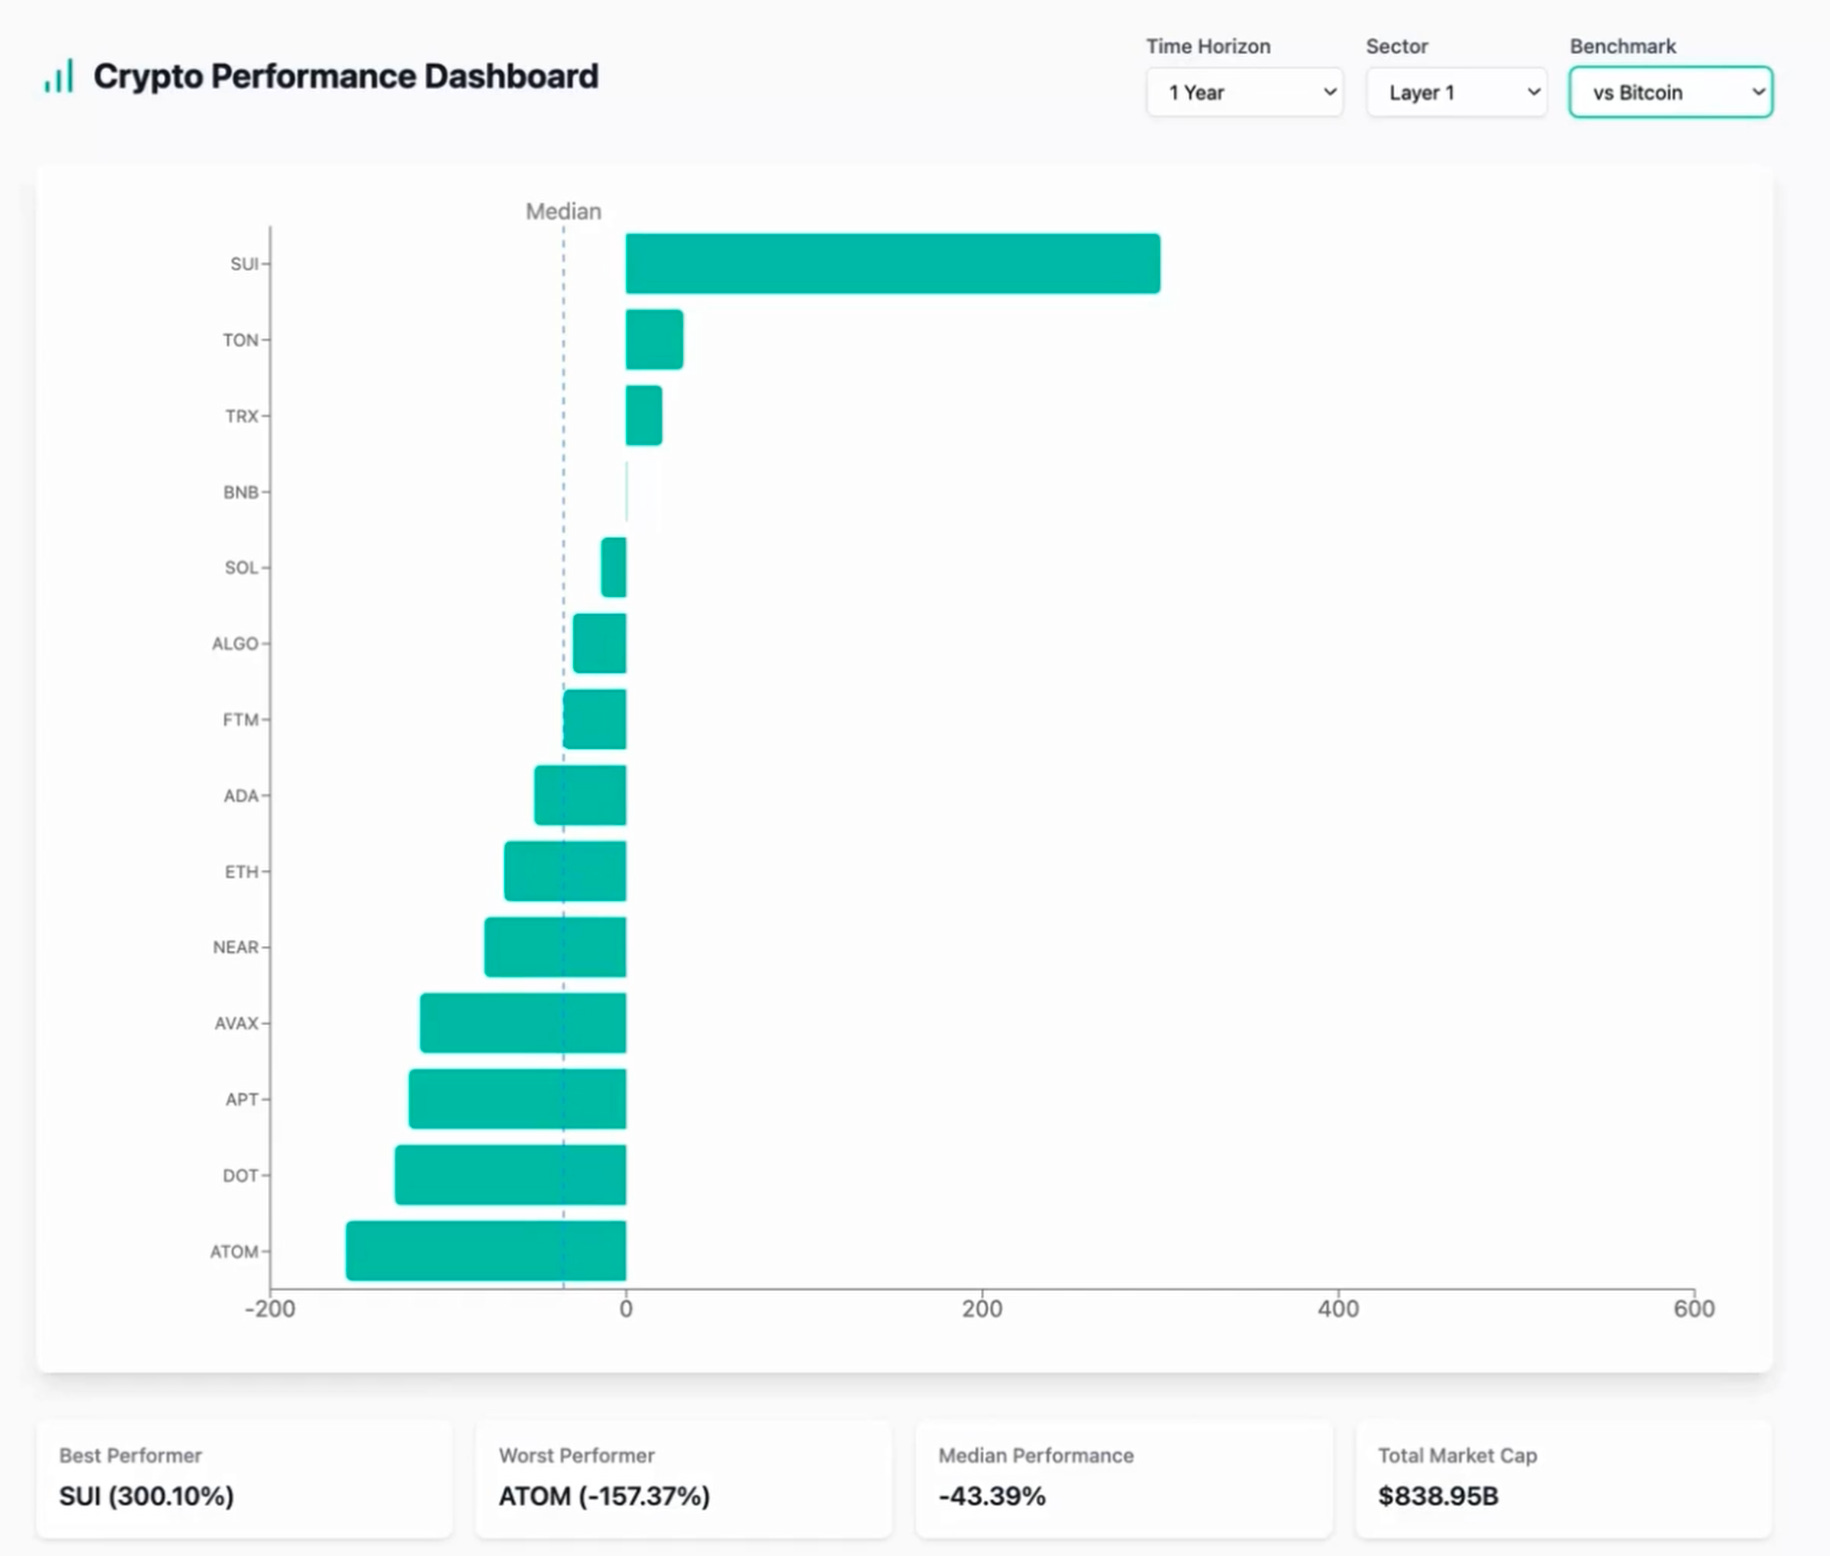
But here's where it gets really interesting: when we compare these Layer 1 protocols to Bitcoin, the picture changes dramatically. The median performance of the selected Layer 1 protocols compared to Bitcoin is around minus 43%
And many of these protocols actually delivered lower returns than BTC - which really makes you think about risk versus reward!
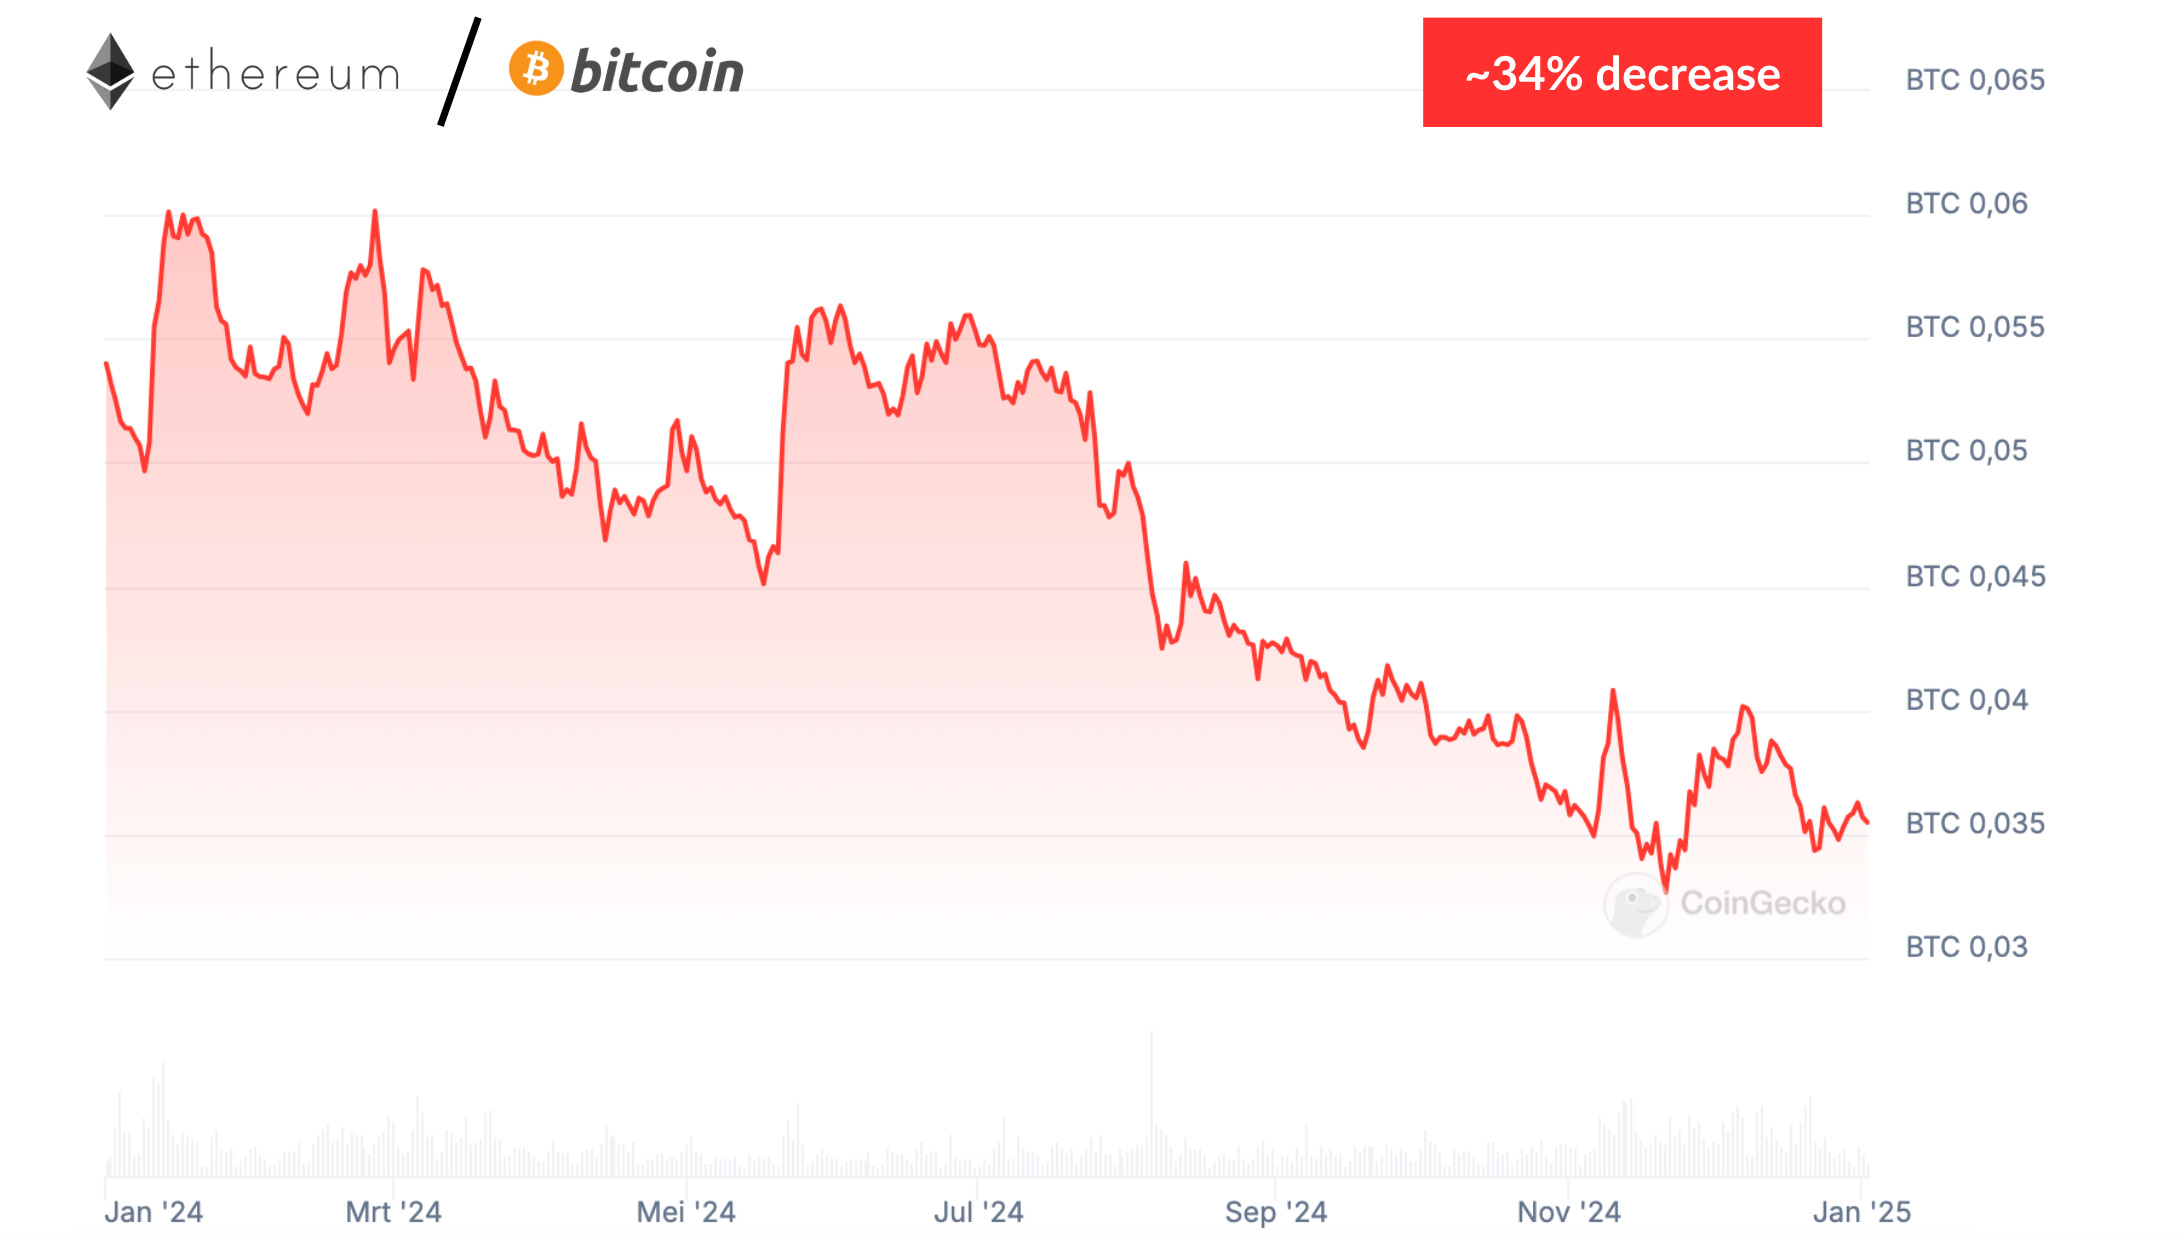
Let's talk about Ethereum, the second-largest crypto by market cap.
2024 hasn't been its strongest year - while Bitcoin was breaking records and hitting new all-time highs, ETH has lost ground against BTC. To put this in perspective: the ETH/BTC ratio dropped from 0.054 to 0.037 in the last year. And while Bitcoin was making headlines with new peaks, ETH is still sitting well below its previous high of $4,900.
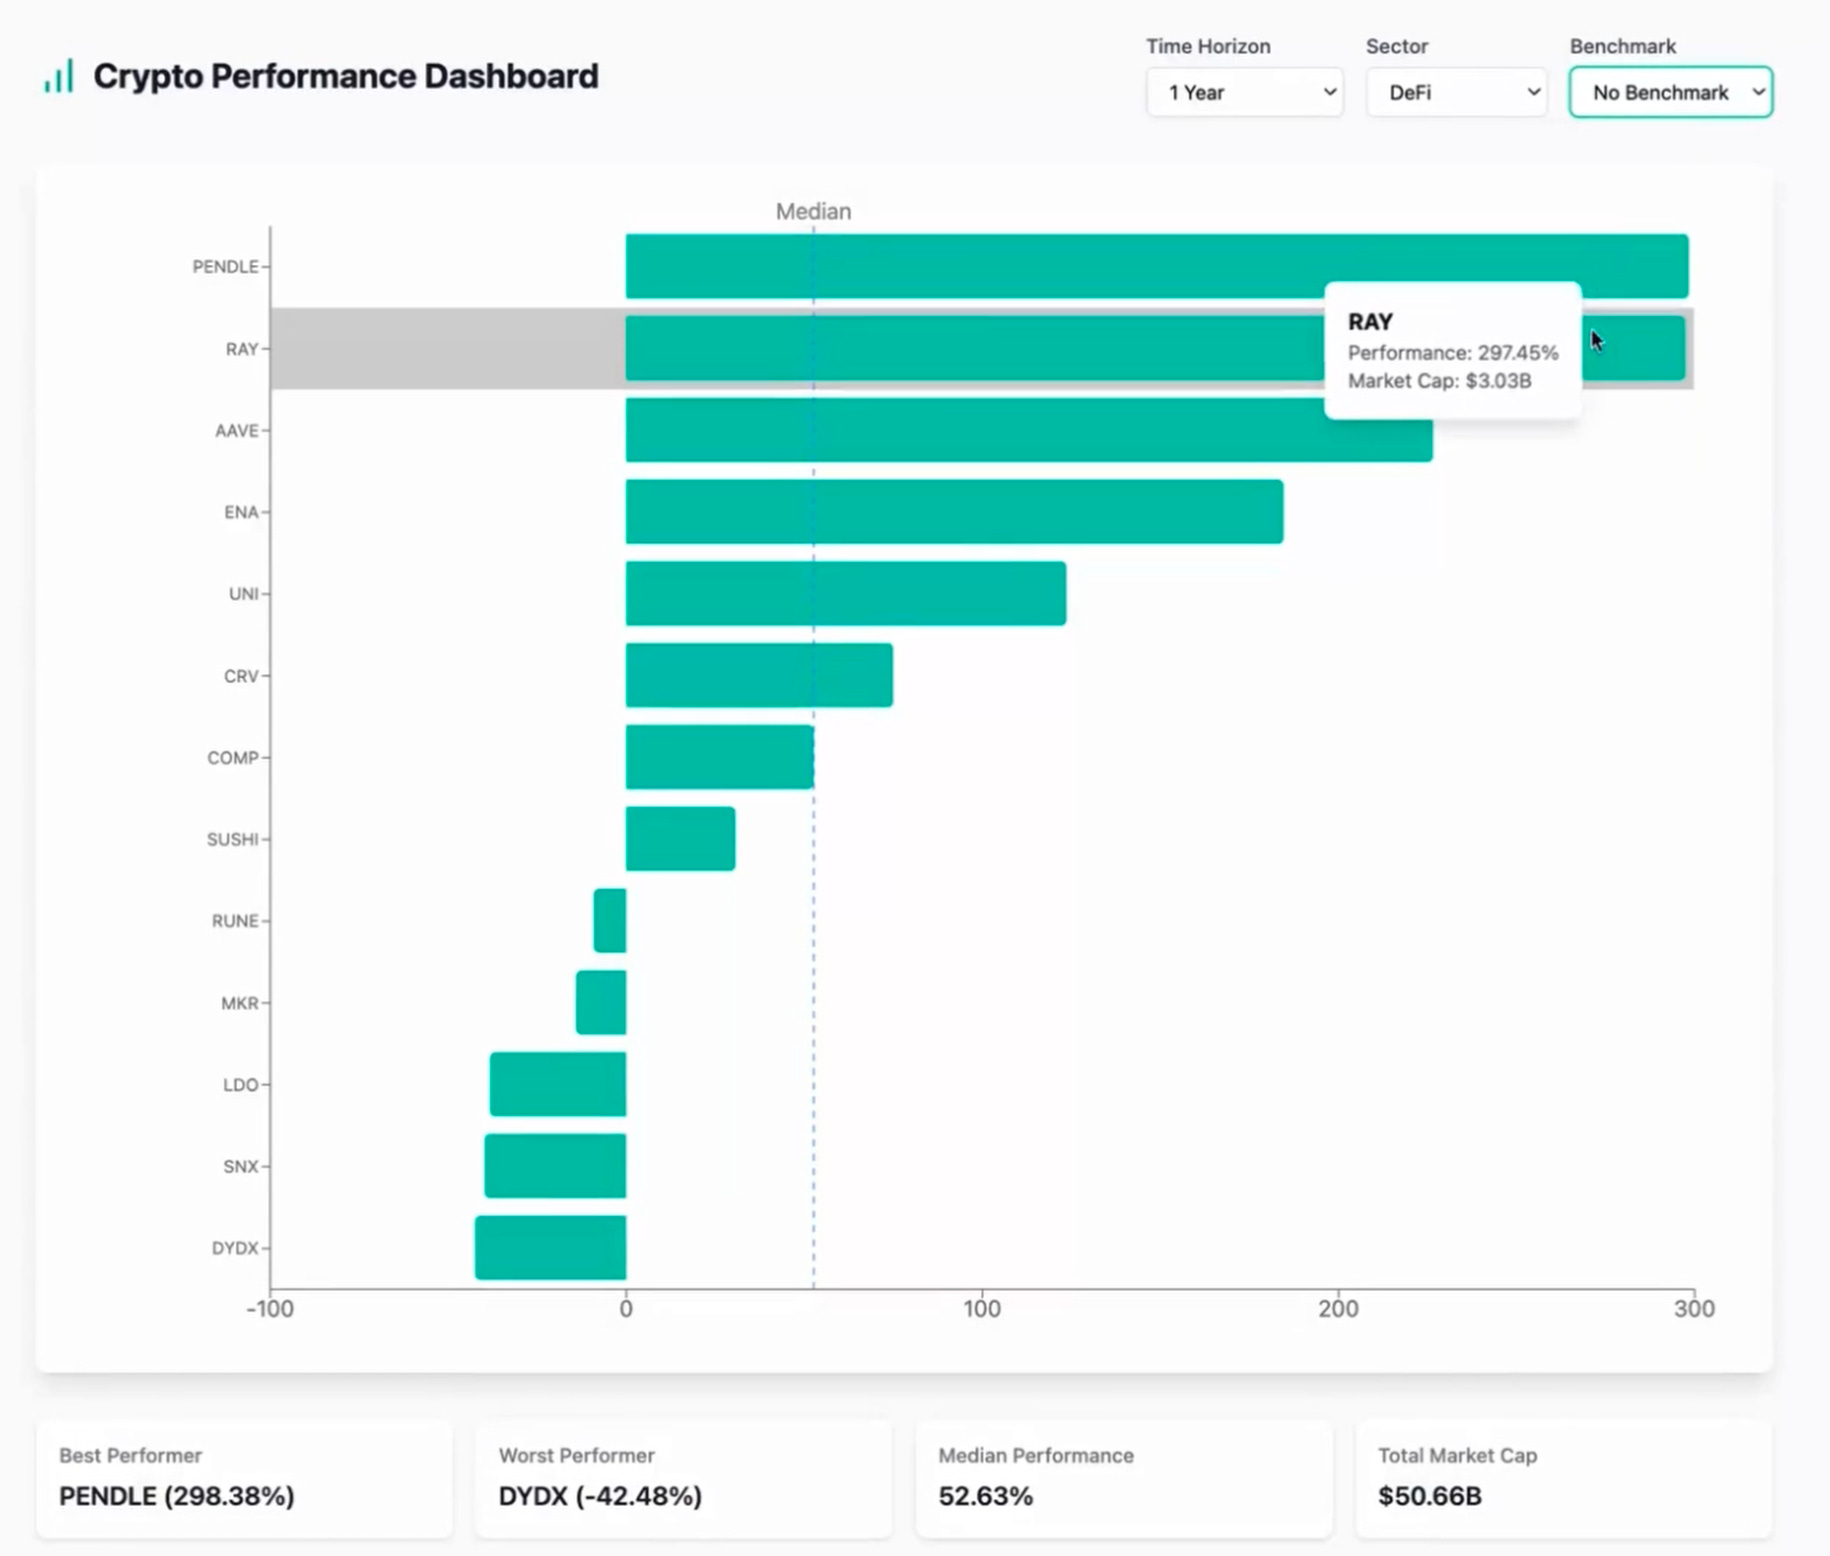
DeFi sector
Let's switch gears and check out how the DeFi sector has been performing.
The DeFi sector also shows some impressive gains, with Pendle and Raydium (RAY) stealing the spotlight among their peers.
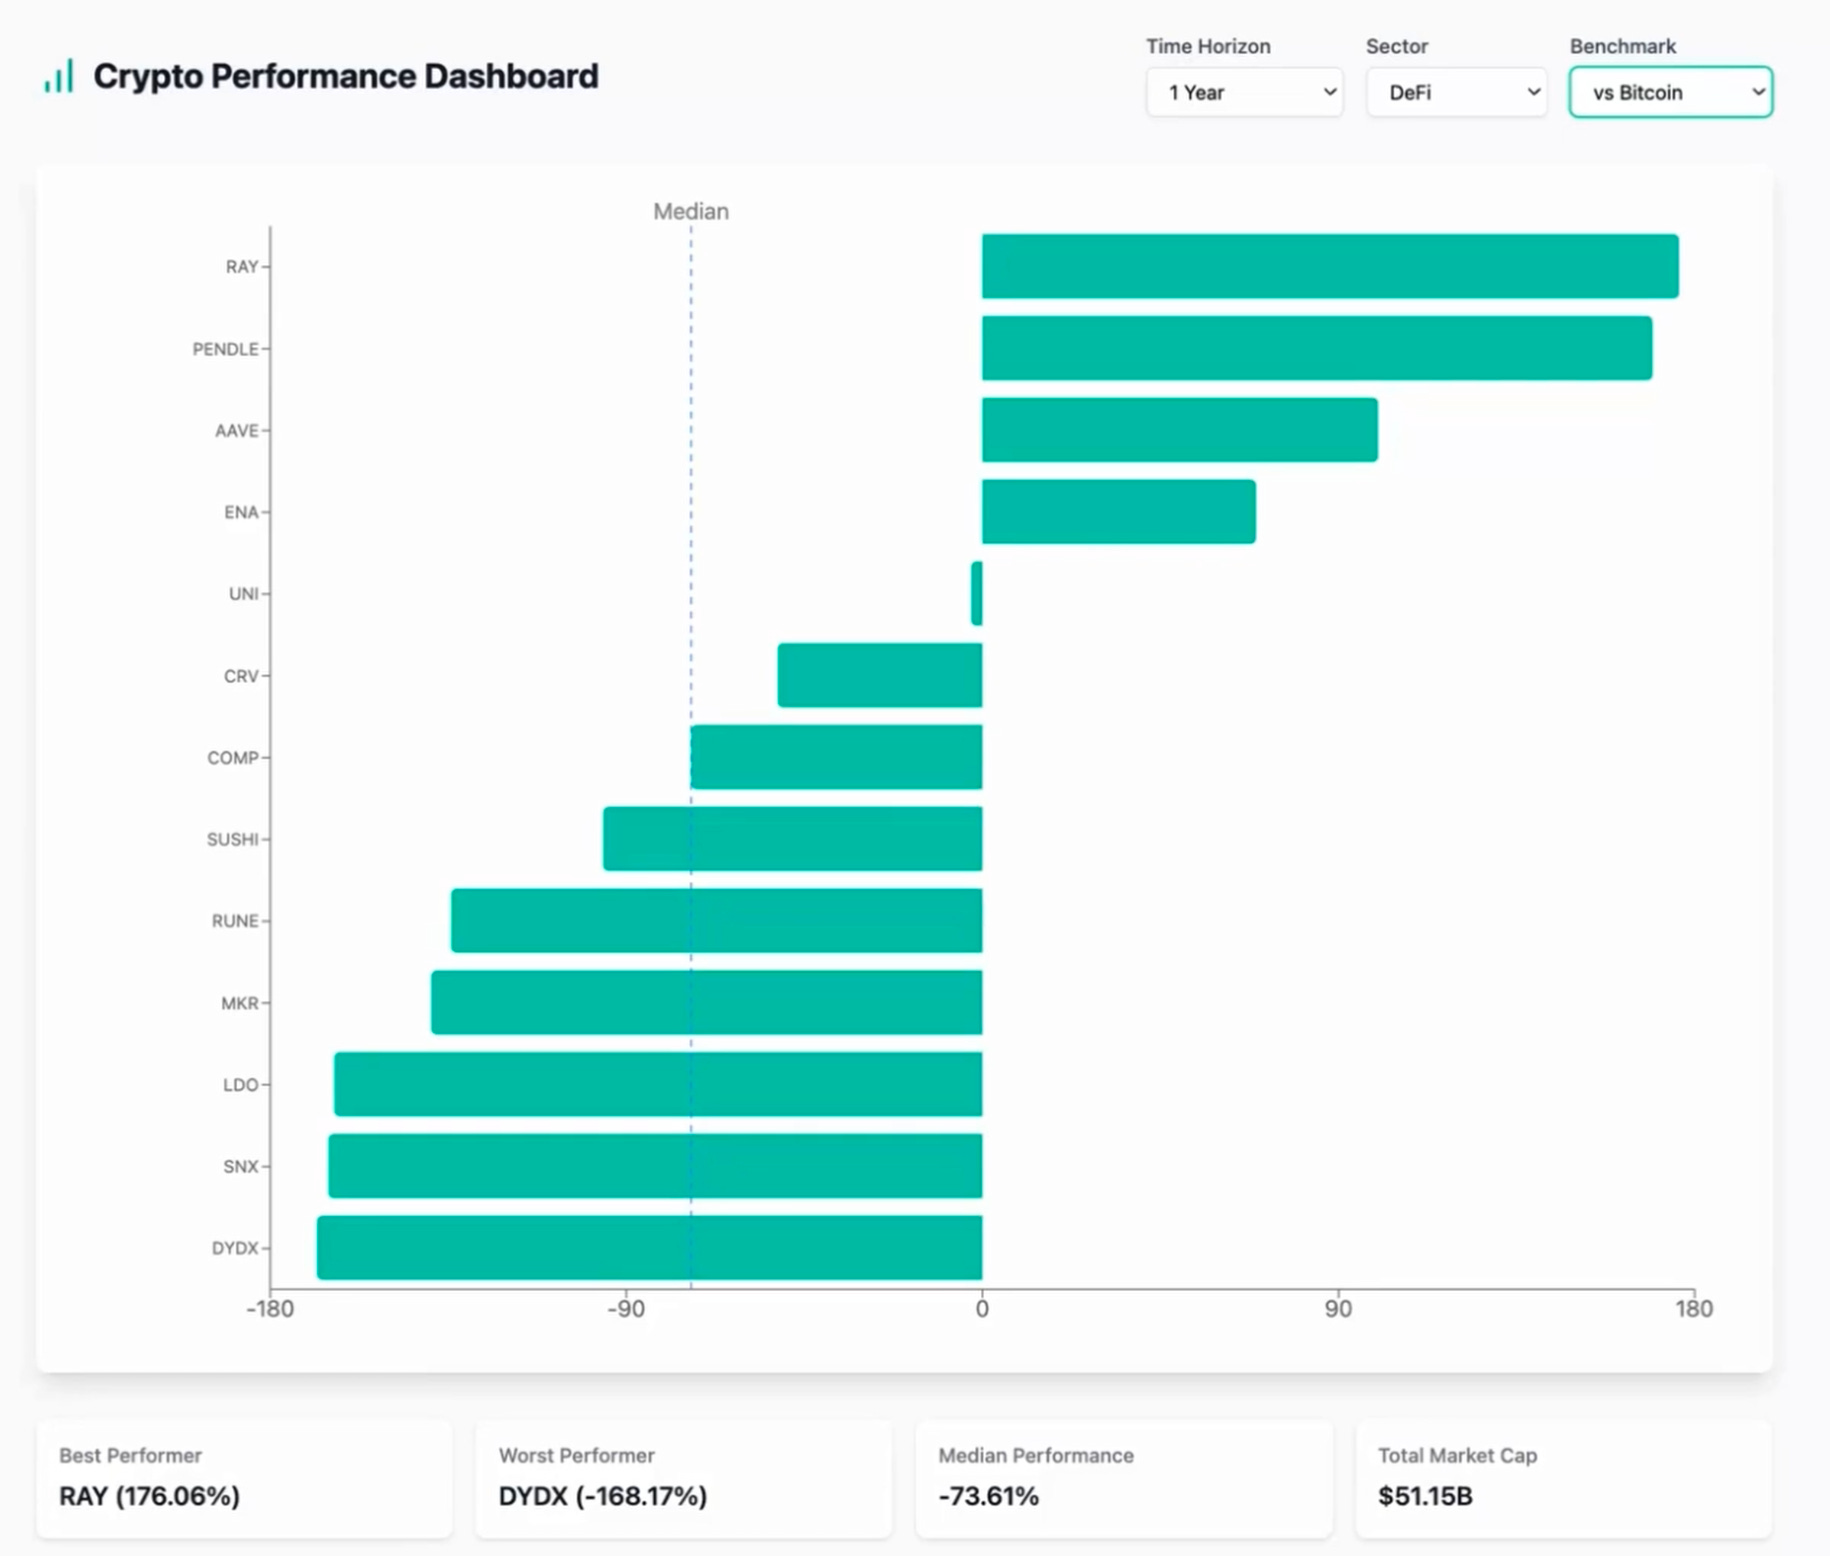
Much like the Layer 1 narrative, many DeFi protocols are actually lagging behind Bitcoin's remarkable run.
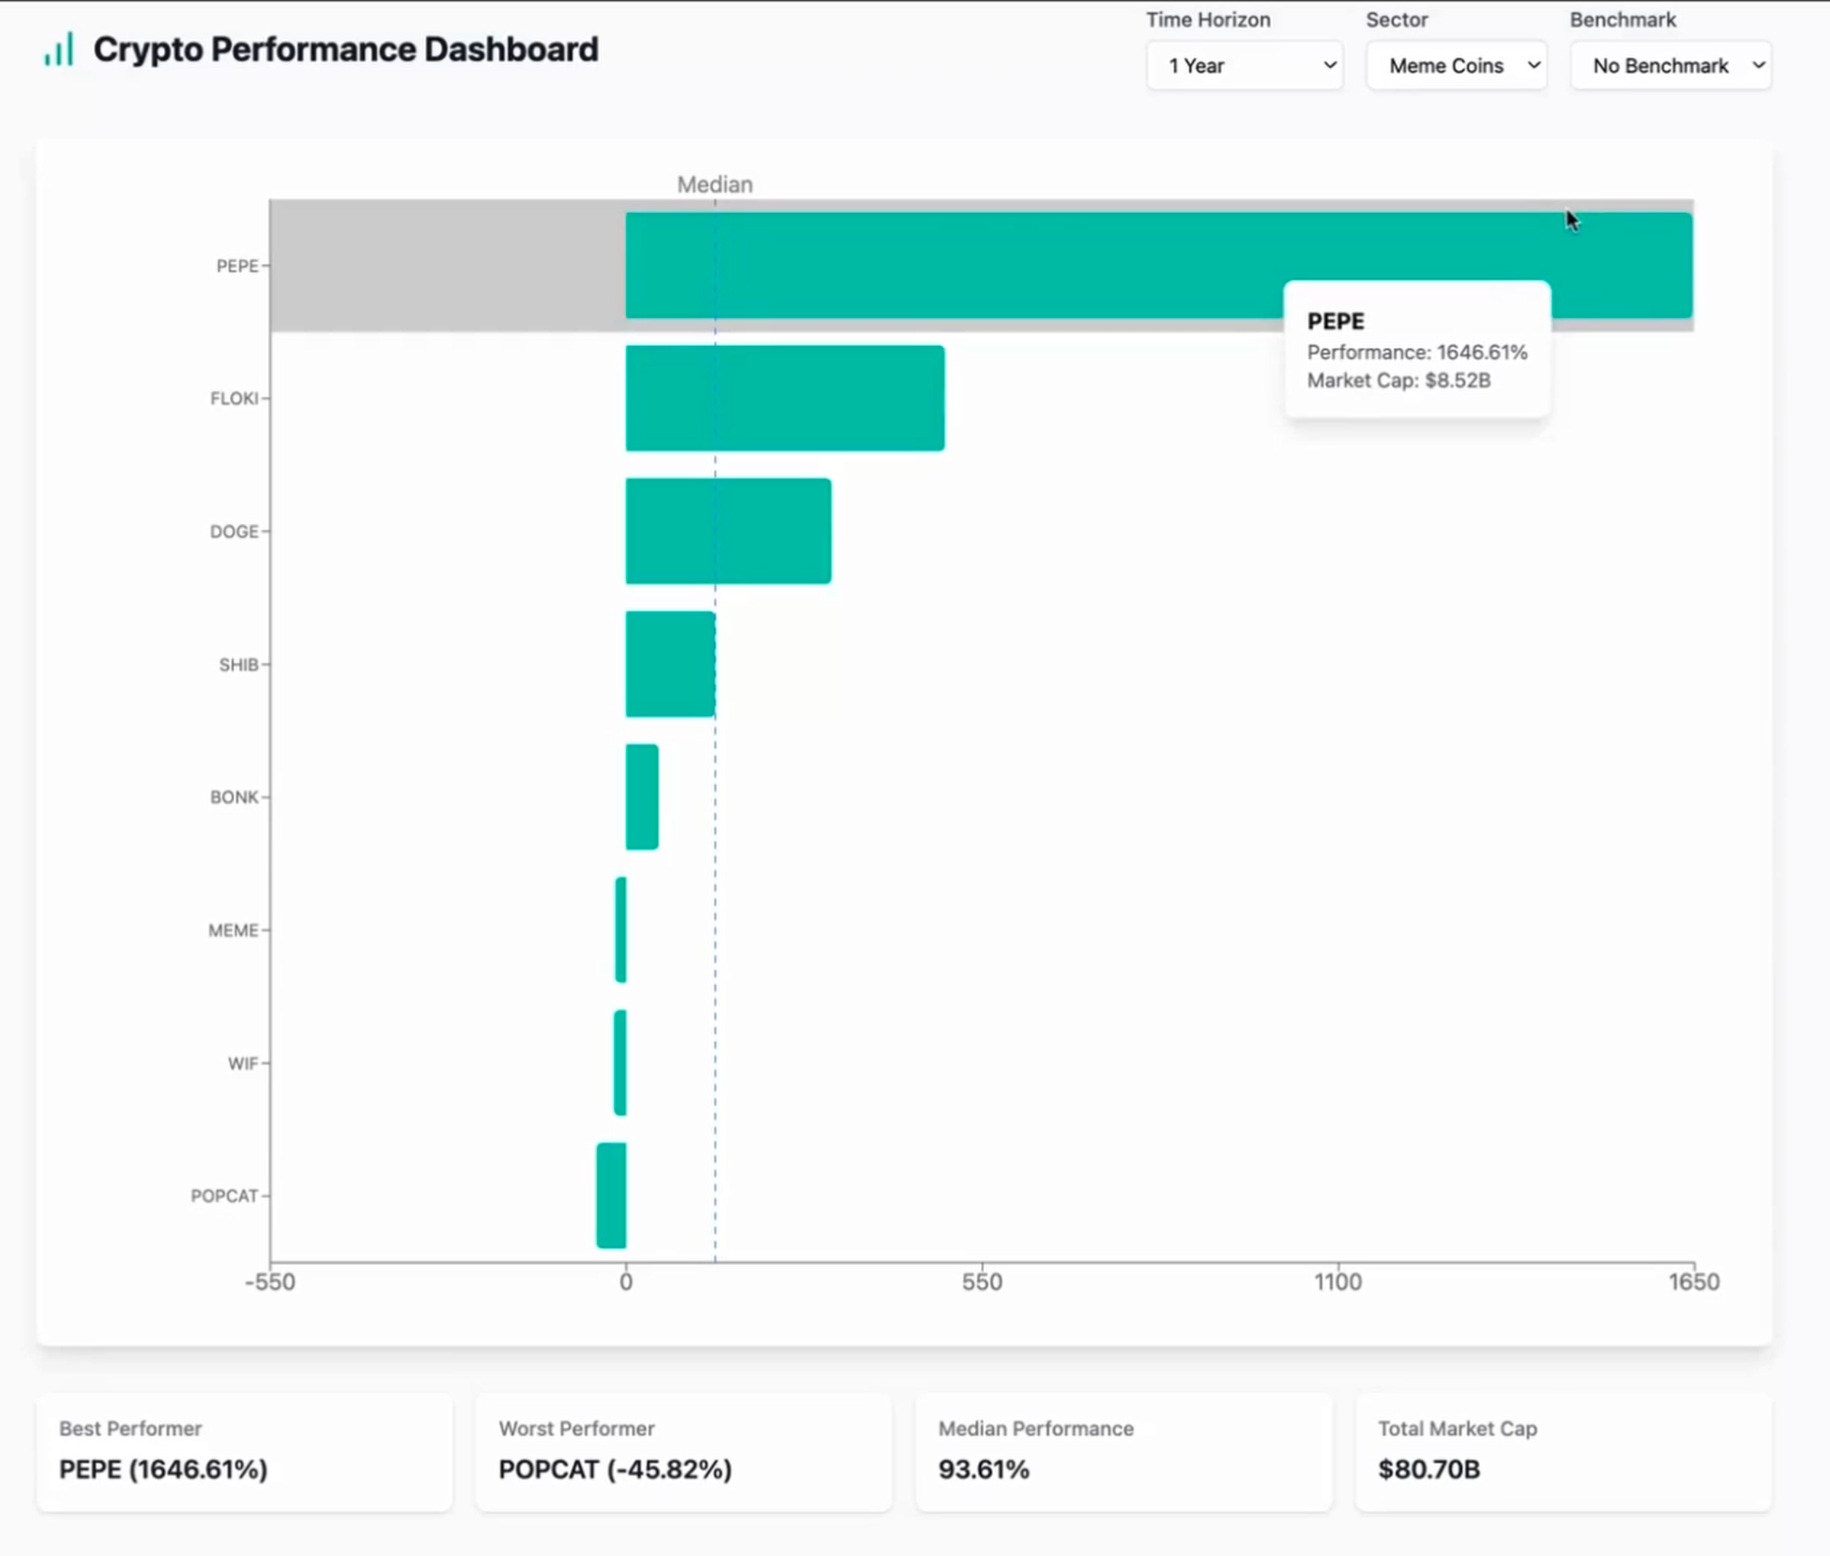
Memecoin sector
Shifting to the meme coin sector, we've seen characteristic volatility in action.
Despite a sharp 30% market cap decline in December, certain players like PEPE have delivered staggering returns - we're talking about 1,600% gains over the past year.
What's particularly noteworthy here is that even when measured against Bitcoin and Ethereum's strong performance, PEPE's returns remain exceptional. This case perfectly illustrates why relative performance analysis is so vital - it helps us identify truly outstanding performers even in a bull market where everything seems to be going up.
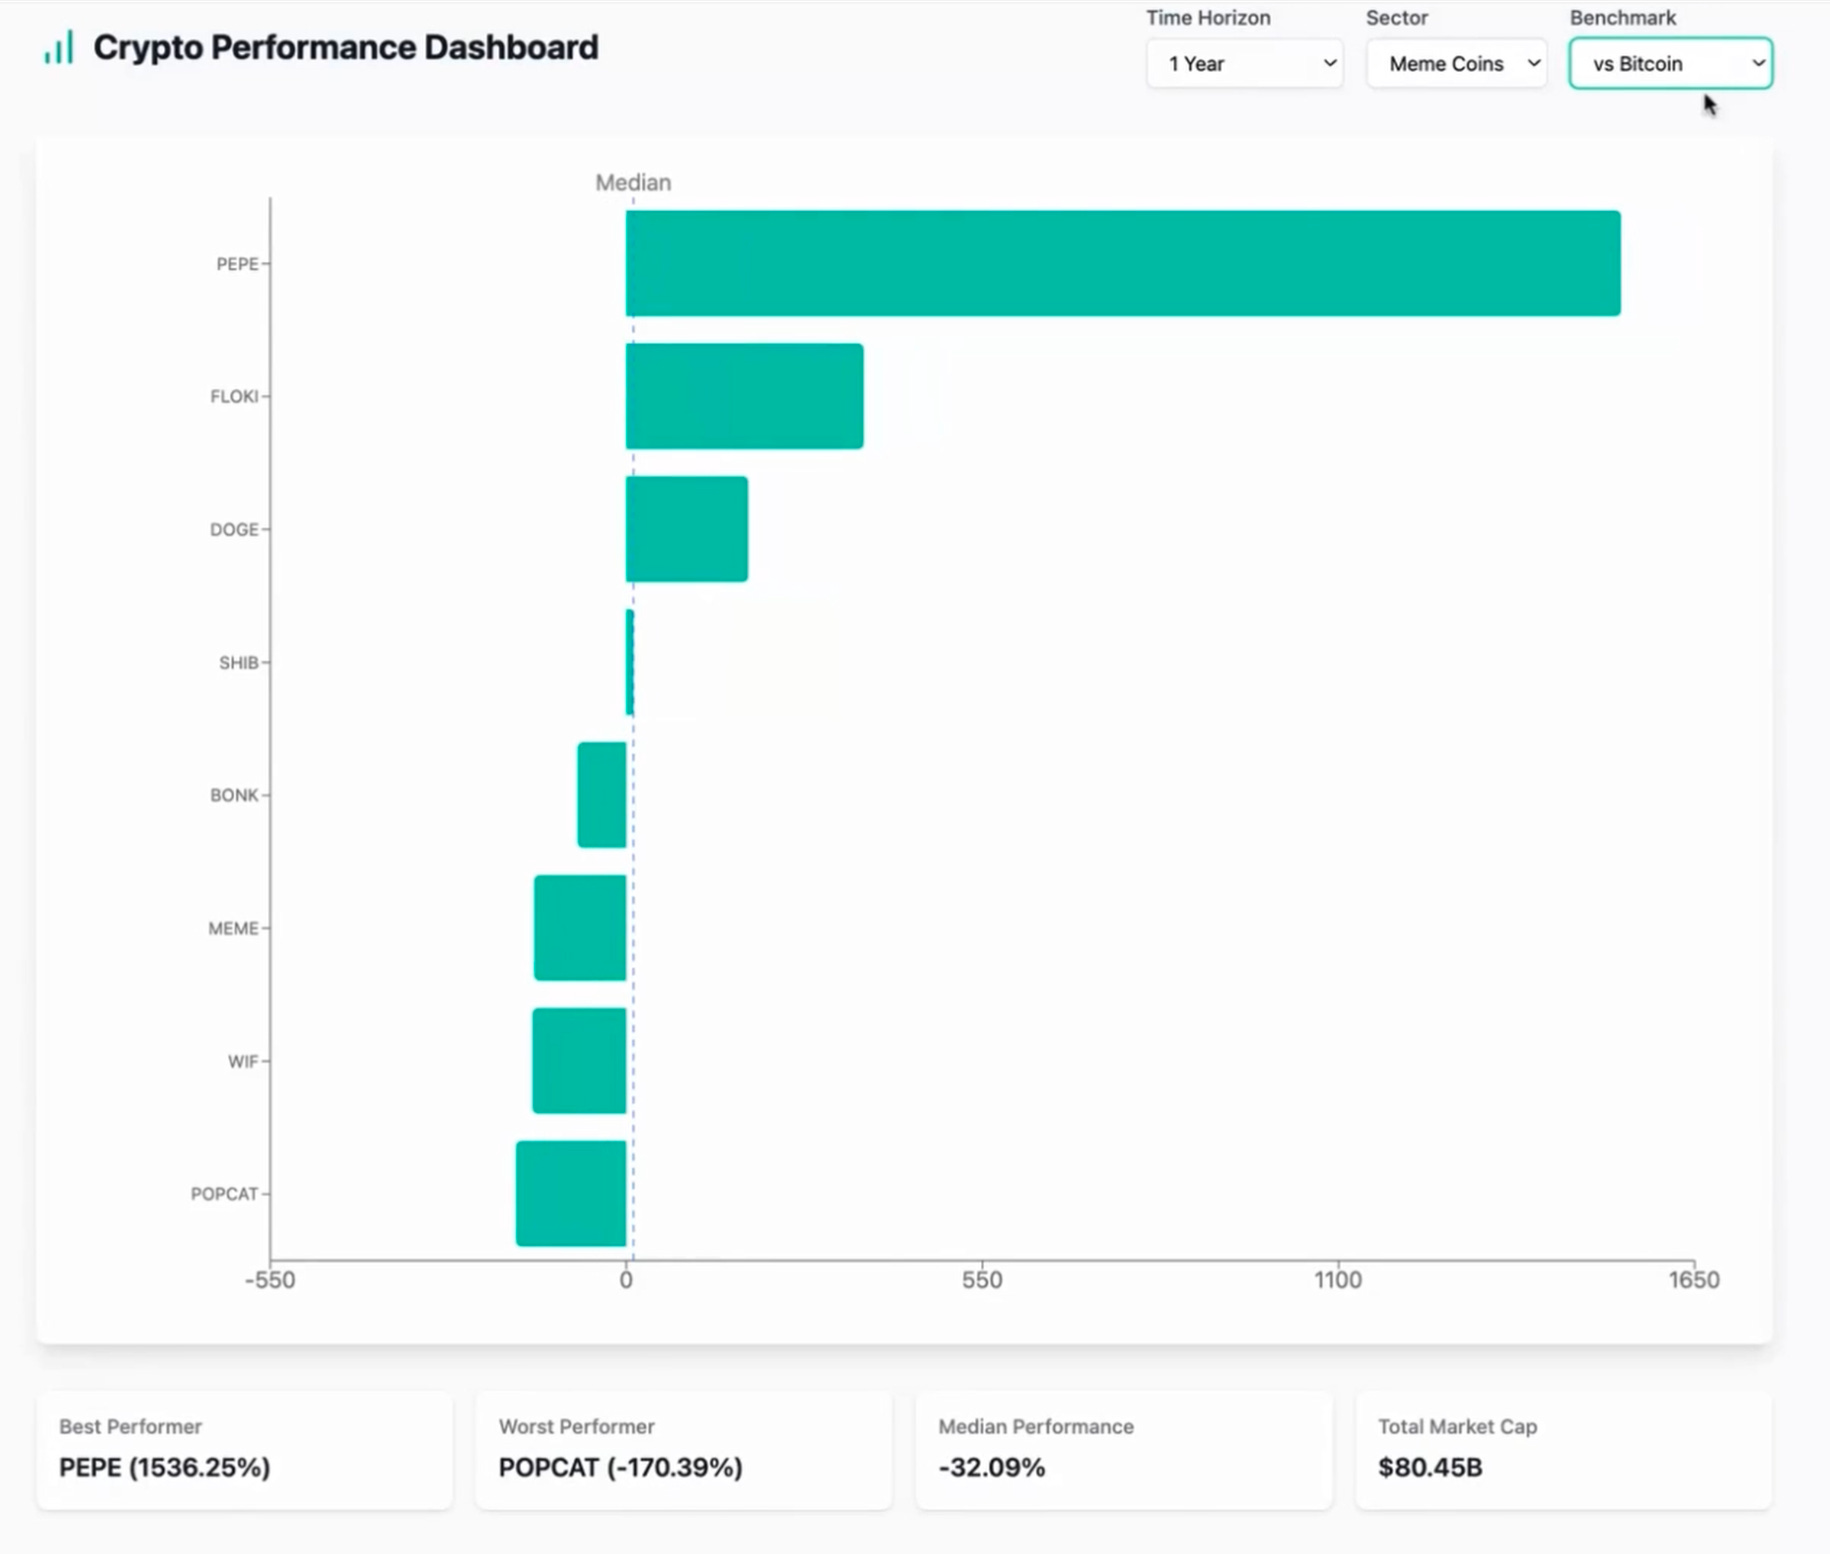
When an asset outperforms both BTC and ETH by such a margin, it's worth paying attention to - though always with the understanding that past performance doesn't guarantee future results, especially in the highly speculative meme coin sector.
Now what?
Now that we've analyzed the relative performance across crypto sectors, let's tackle the million-dollar question: where might the smart money flow in 2025?
While no one can predict the future with certainty, we can explore some high-probability scenarios that could unfold throughout 2025. Keep in mind these scenarios often overlap and can occur in sequence rather than in isolation.
First, we could see continued Bitcoin dominance.
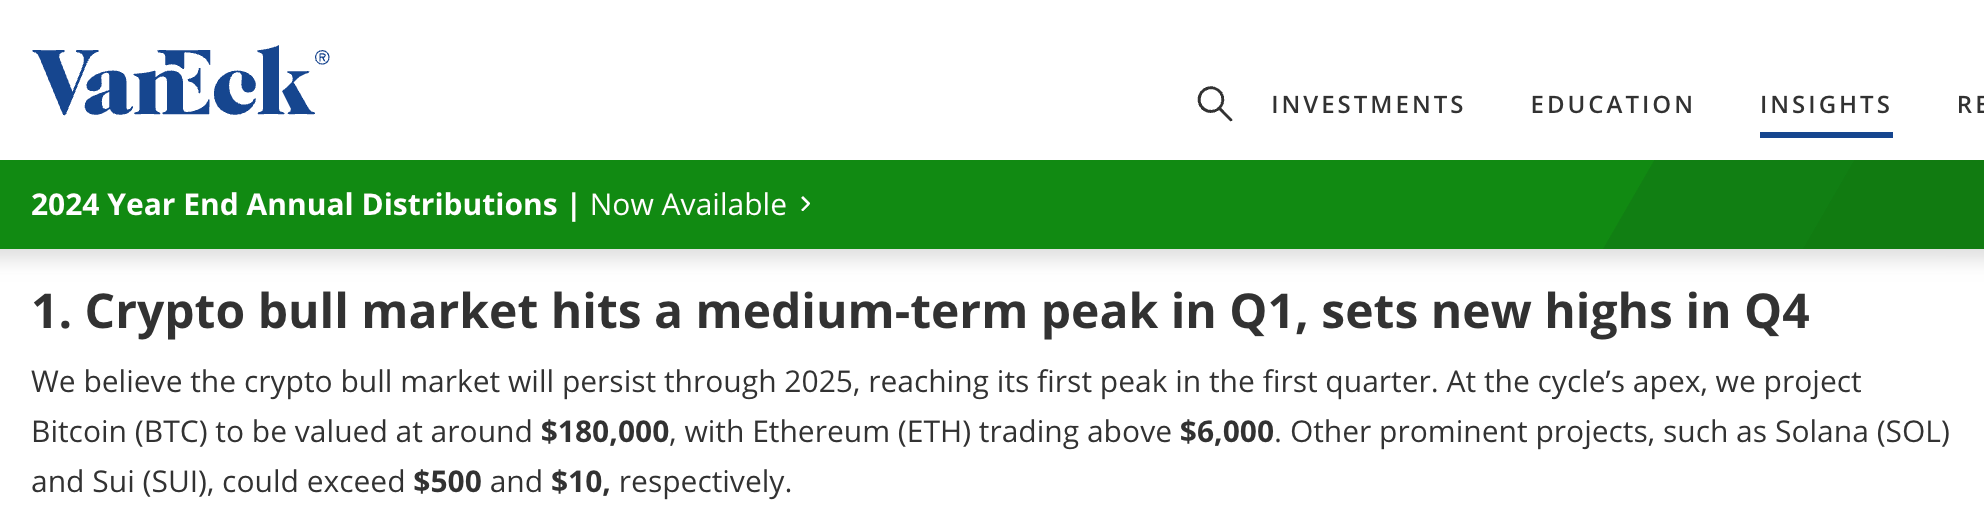
Major institutions like VanEck and Standard Chartered are projecting Bitcoin prices between $180k to $250k, driven by institutional adoption and ETF inflows.
In this scenario, you'd want to maintain significant Bitcoin exposure.
Then there's the sector rotation scenario (“alt season”).
The crypto market has shown us time and time again - when Bitcoin reaches new heights and consolidates, capital naturally flows into alternative cryptocurrencies.
This "altcoin season" typically sees smaller market cap tokens significantly outperforming Bitcoin. We could see altcoins like Ethereum and Solana capturing substantial value, while the expanding stablecoin ecosystem creates new opportunities across the board.
In this scenario, altcoin exposure could deliver superior returns compared to holding Bitcoin alone.
However, we must also consider a more bearish scenario.
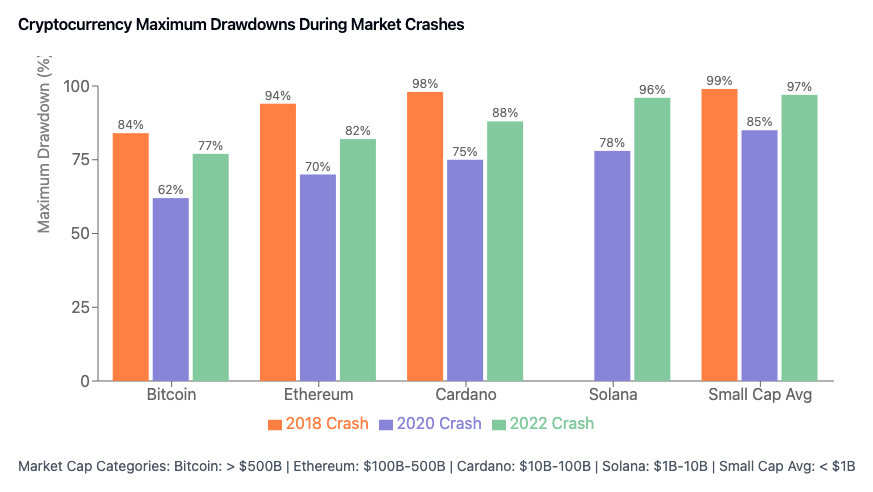
If a recession happens in 2025, we could see a dramatic shift in market sentiment. During economic uncertainty, investors typically retreat from high-risk assets, and cryptocurrencies could face significant selling pressure. Historical patterns show that Bitcoin has previously lost up to ~84% of its value just on recession fears alone.
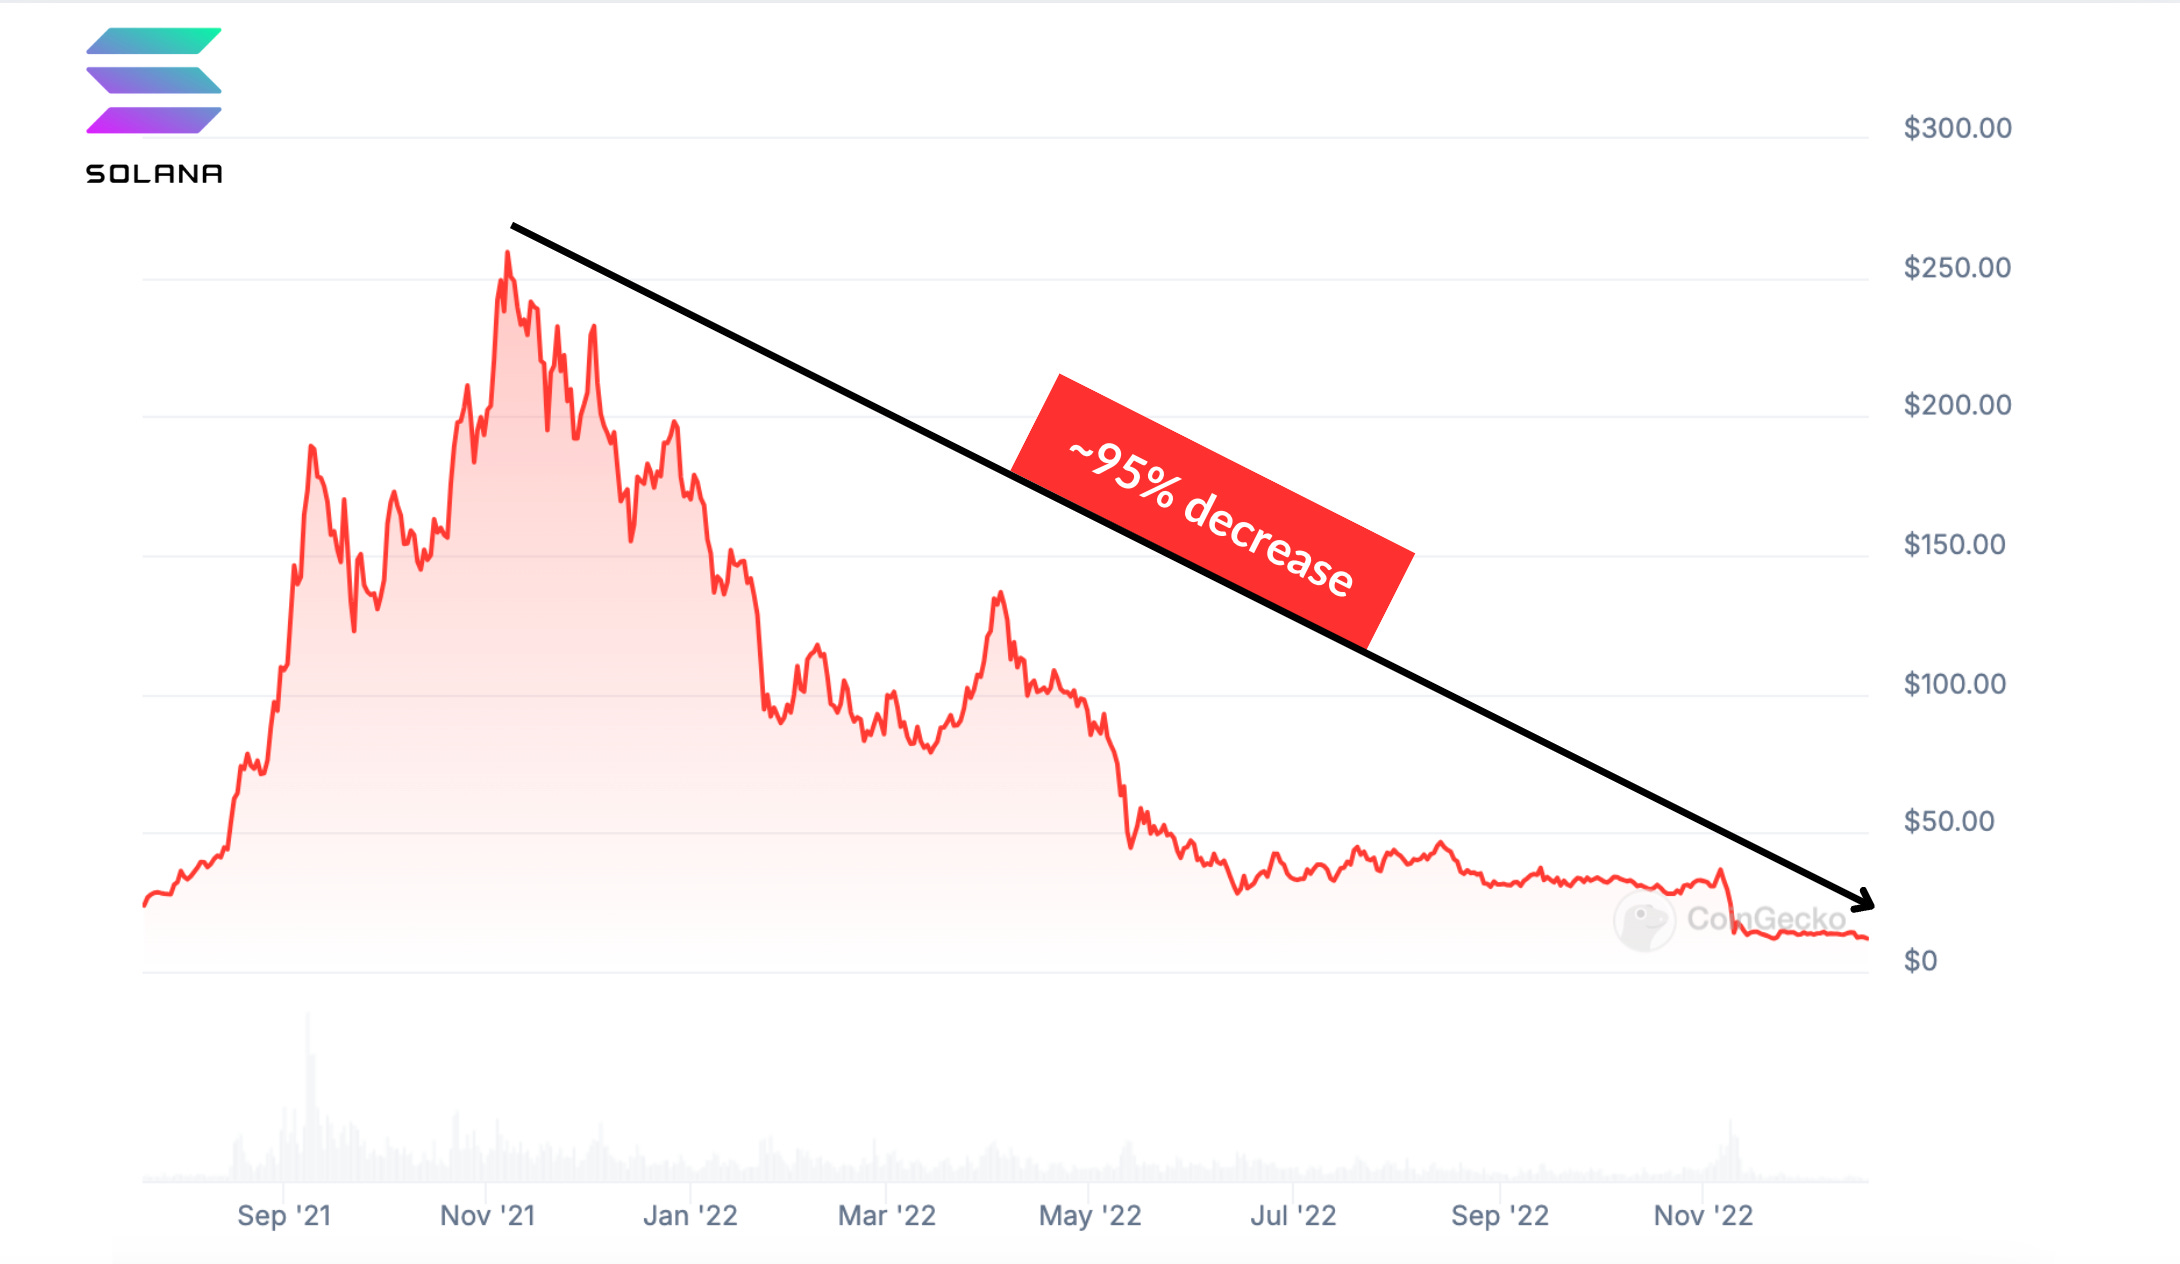
Altcoins typically face even more brutal selling pressure than Bitcoin - during market crashes, many altcoins can lose up to 95% of their value, as we saw with Solana's drop from $260 to $12 in the previous cycle.
Even established projects aren't immune to these dramatic drawdowns, and the smaller the market cap, the more severe these corrections tend to be. Many tokens could potentially become worthless in such a scenario.
Remember - success in crypto requires adaptability. Your strategy should be fluid enough to capitalize on whichever scenario dominates the market, while always maintaining proper risk management to protect against potential downside risks.
Key takeaways
Success in crypto investing isn't just about making gains – it's about understanding how your portfolio performs against key benchmarks like Bitcoin and Ethereum, and measuring your returns against the sectors you're invested in. This data-driven approach helps you to spot opportunities and adjust your strategy when needed
As we look toward 2025, many analysts are projecting Bitcoin to reach unprecedented levels ($180K-$250K), potentially triggering explosive altcoin rallies. While these scenarios are exciting, remember to stay flexible with your strategy and keep strict risk management in place – markets can turn bearish when least expected.
I'm working on expanding the application shown earlier. The next iterations will feature amongst others:
Additional sector breakdowns
Risk-adjusted return metrics
More comprehensive benchmarking tools
Your input matters! What features would help you make better investment decisions?
Drop your suggestions in the comments – I read every one.
Until next time, stay sharp and keep measuring what matters.
Don’t forget to hit the “♡ Like” button!
Likes are a big deal. They serve as a proxy for new visitors and feed into Substack’s algorithm that distributes my articles to all Substack readers.
Better yet…share this article with your community.
If you enjoyed this thread and want to receive similar posts in the future, please subscribe below.
https://factor.fi/
Have you used this yet?